Building TaskDashboard Through User Feedback
How discovery and four focused feedback rounds shaped a desktop tool around ongoing responsibilities, blocked work, and reporting.
- #local-first
- #react
- #agile
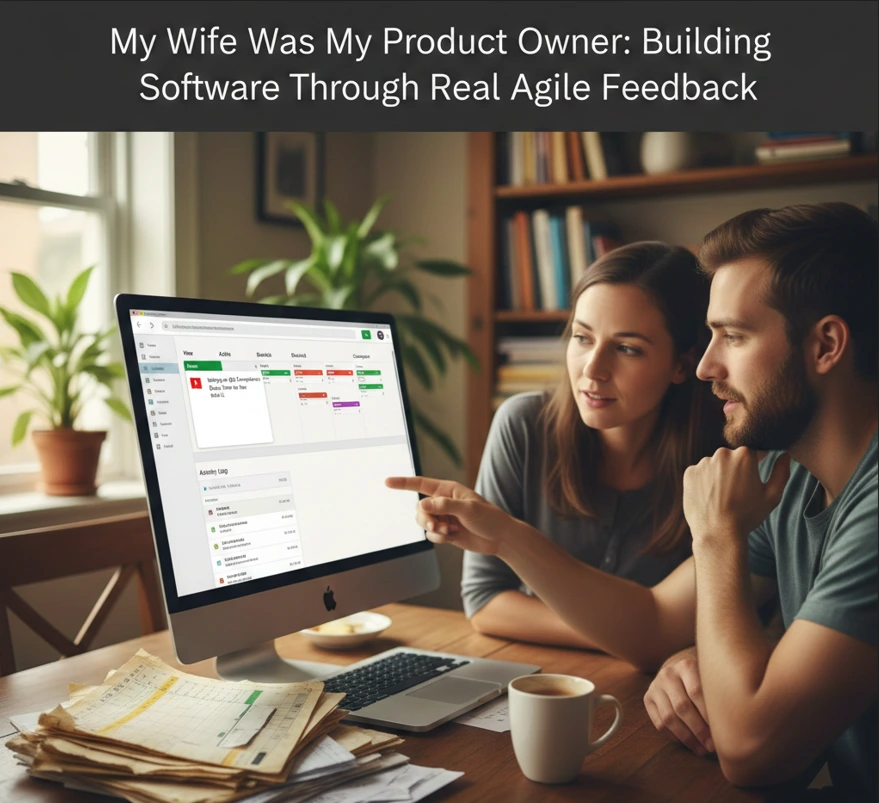
I built a version of TaskDashboard for my wife, an HR professional whose work was spread across spreadsheets and email. The difficult part was preserving context: why an item was blocked, what had changed, and what had been completed over a quarter.
The project became a useful exercise in product discovery and incremental delivery. The architecture followed what I learned from her workflow.
Start with the decisions the user needs to make
I asked her to walk through a typical week and the preparation needed for a status meeting. Three needs emerged: record who or what was blocking work, recover the history behind an item, and see deadlines or inactivity without manually comparing dates.
A further distinction shaped the model. Many of her projects were ongoing areas of responsibility, such as employee development and recurring recruitment. They needed to remain useful across repeated cycles of work.
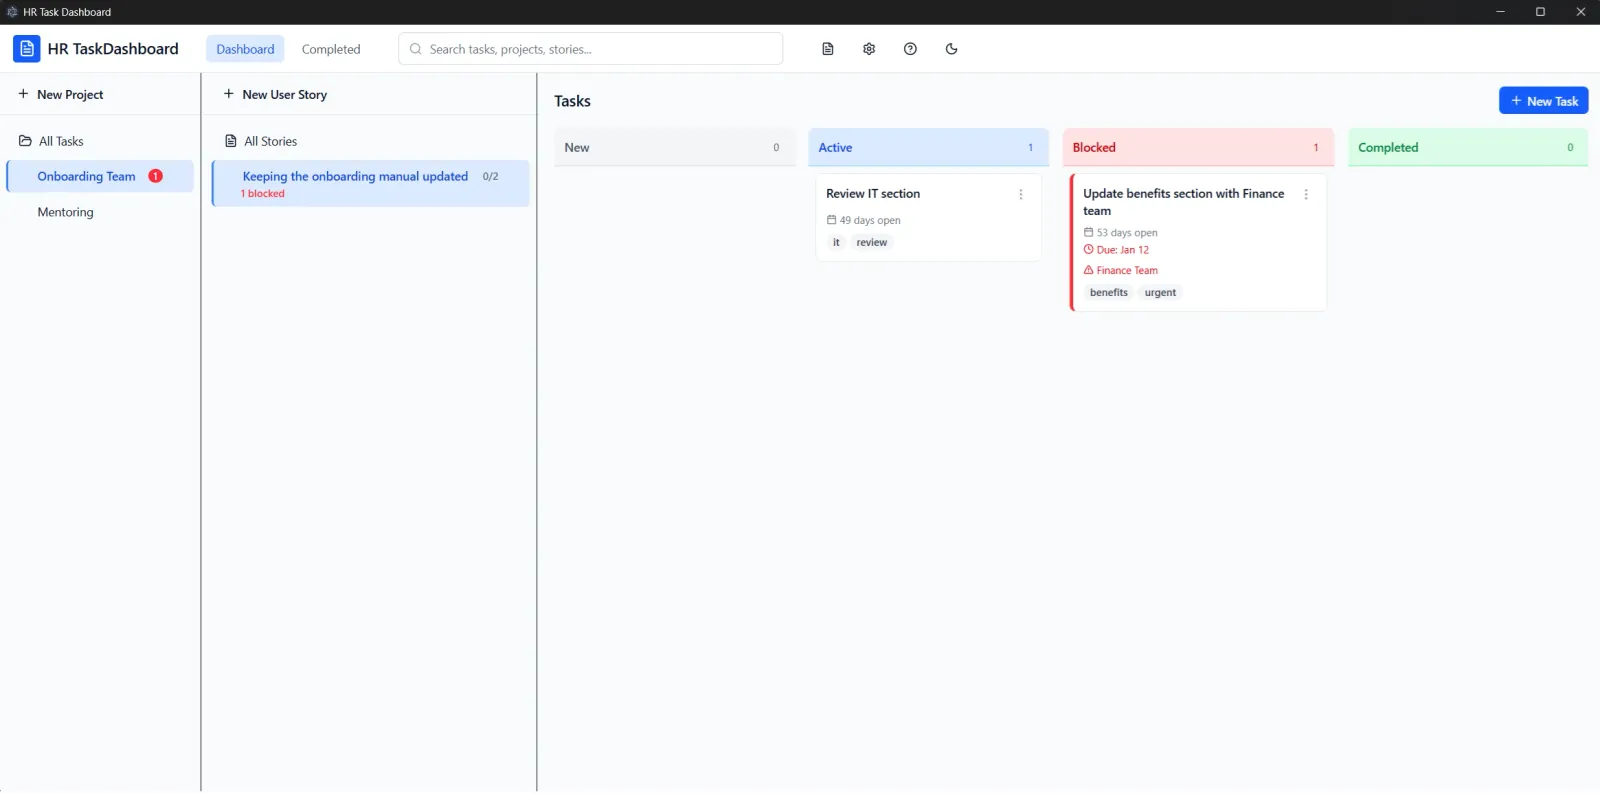
The resulting hierarchy uses projects for areas of ownership, user stories for initiatives, and tasks for concrete actions. This kept the model close to the way she organized her responsibilities.
Iterate around the next useful outcome
The first prototype used React and TypeScript, an Electron desktop shell, and Dexie over IndexedDB for local persistence. Four feedback rounds established the core workflow:
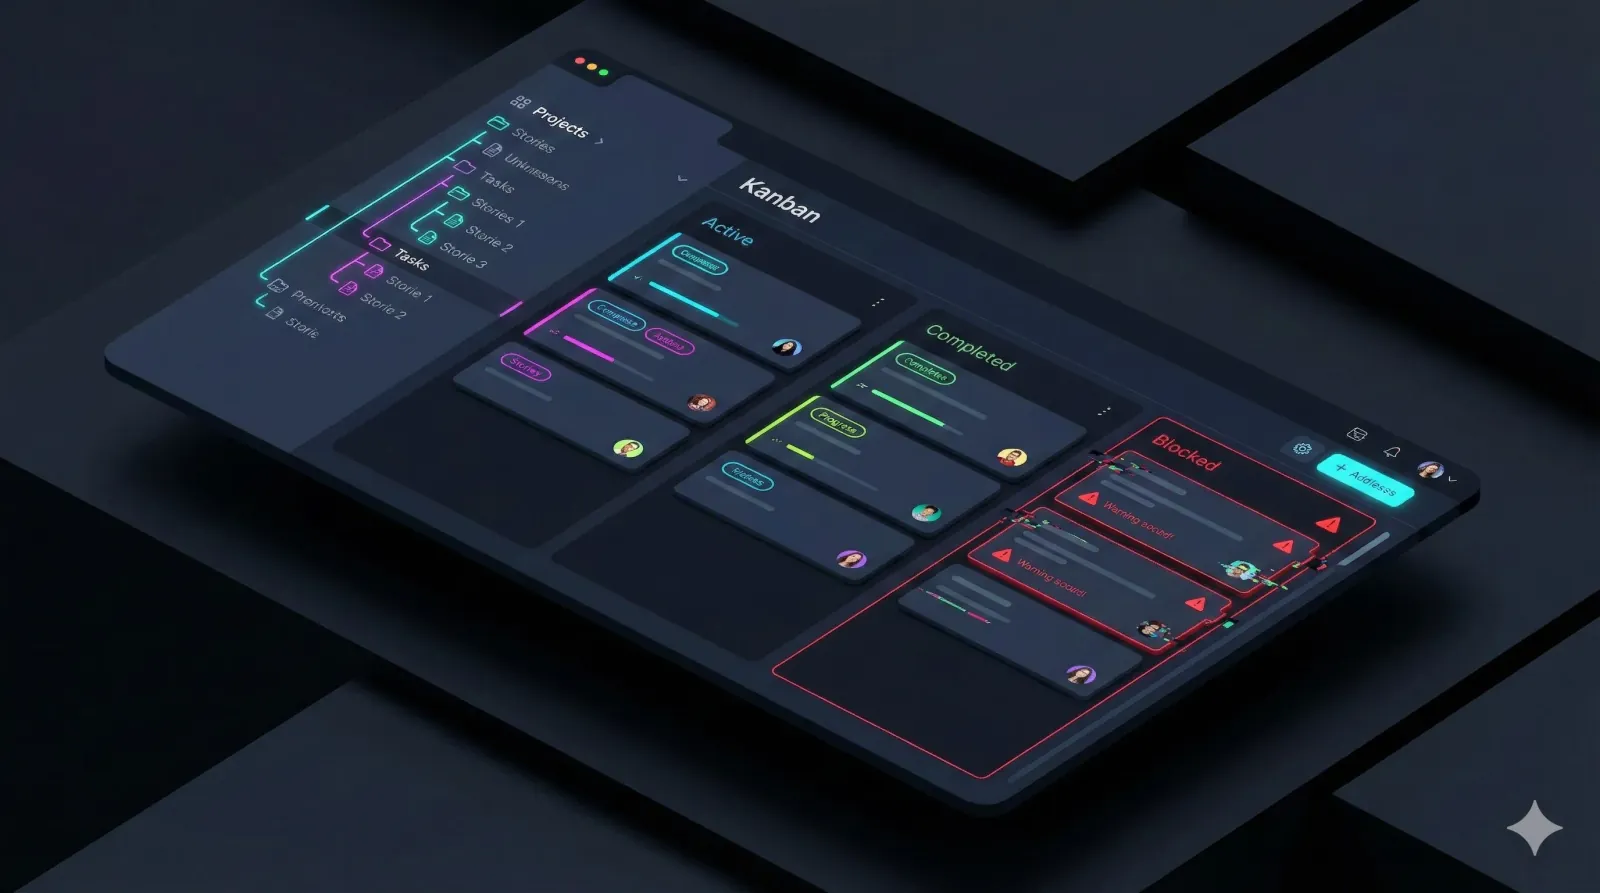
- Structure and navigation. The hierarchy worked, but navigating through it did not answer what needed attention today.
- A decision-focused dashboard. Derived values such as
daysBlocked,isOverdue, andisStalesurfaced blocked, urgent, and inactive items without duplicating those calculations in the stored data. - History and reporting. Timestamped activity entries preserved decisions and updates. Quarterly summaries brought completed work and current blockers into one view.
- Daily usability and recovery. Reordering, resizable navigation, keyboard shortcuts, and JSON export/import reduced friction. An explicitly configured portable build kept the executable and its data together.
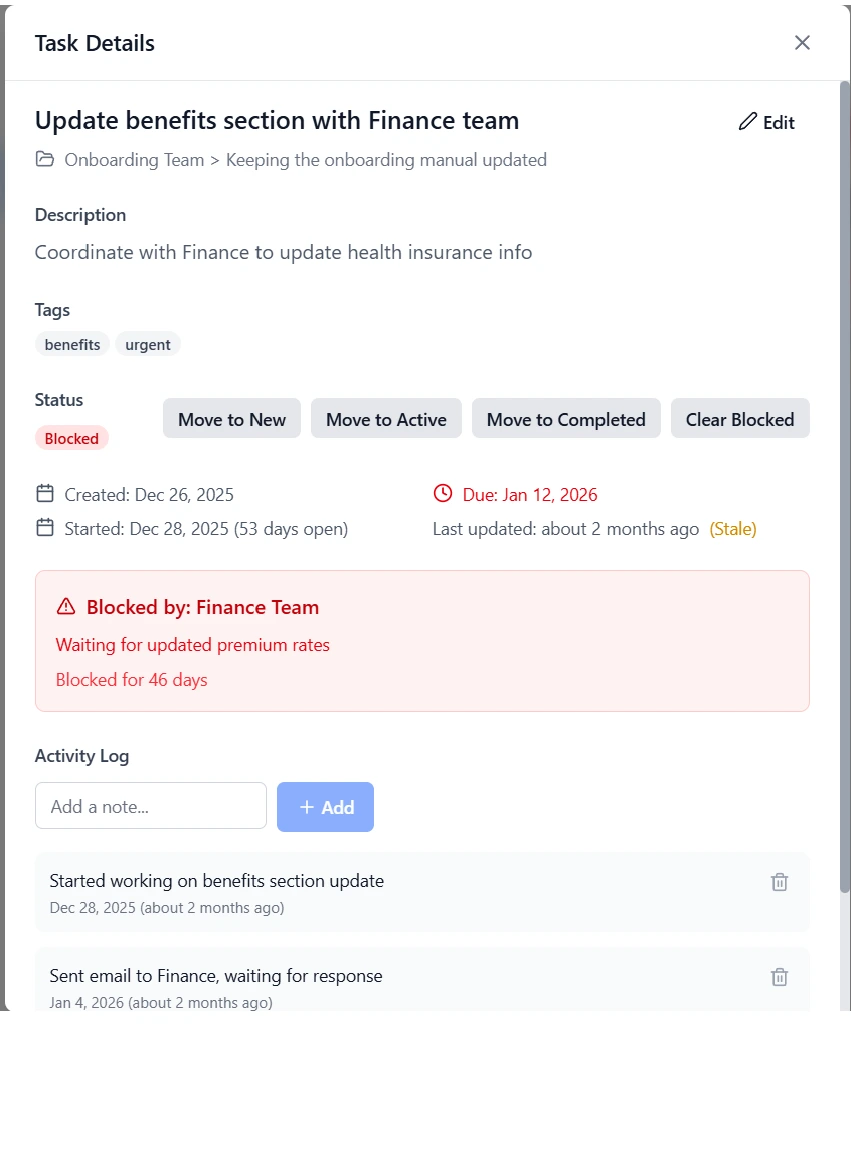
Each round answered a concrete question about the workflow. A working version gave us better feedback than discussing a feature list in isolation.
Evaluate adoption in the actual workflow
She began using the application daily, including reviewing blocked items and activity history before meetings. That was more meaningful than a positive reaction to a demonstration: the tool had become part of the work it was intended to support.
The reporting feature also made it easier to retrieve completed work without reconstructing the quarter from separate spreadsheets and messages. I have not treated that observation as a formal productivity benchmark.
Carry the lesson into engineering leadership
The strongest design decision came from understanding ongoing responsibility before implementing the hierarchy. The strongest delivery decision was to keep feedback rounds small enough to change direction.
This project reinforced practices I value in technical ownership: clarify the user's decision, model the relevant context, deliver a reviewable increment, and use evidence from real use to choose the next change.